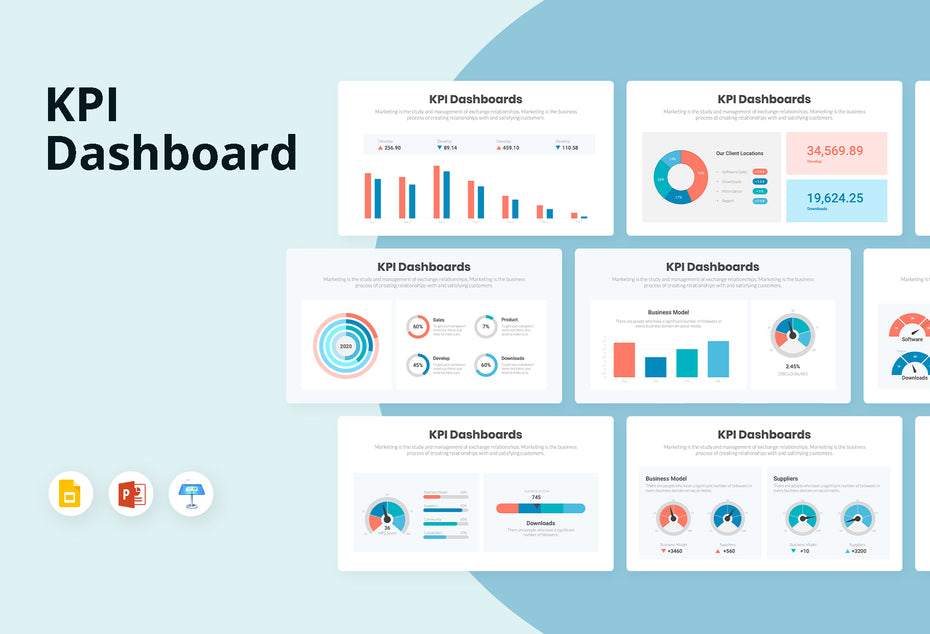
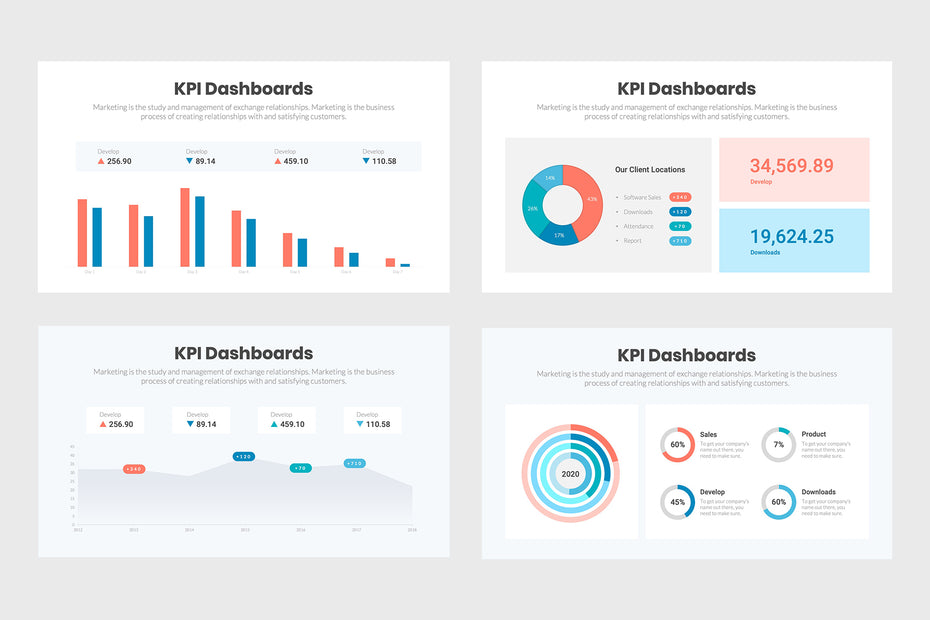


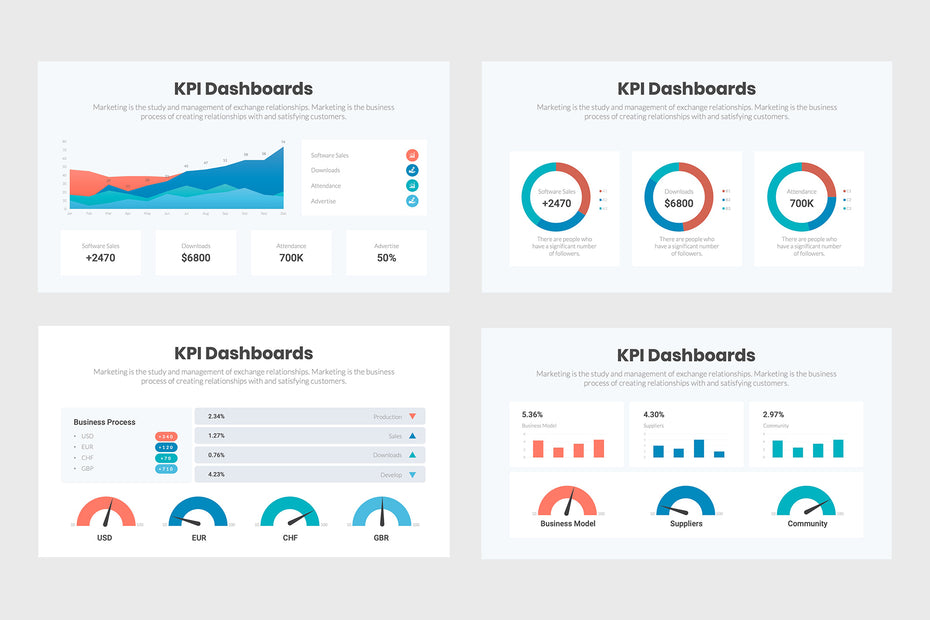
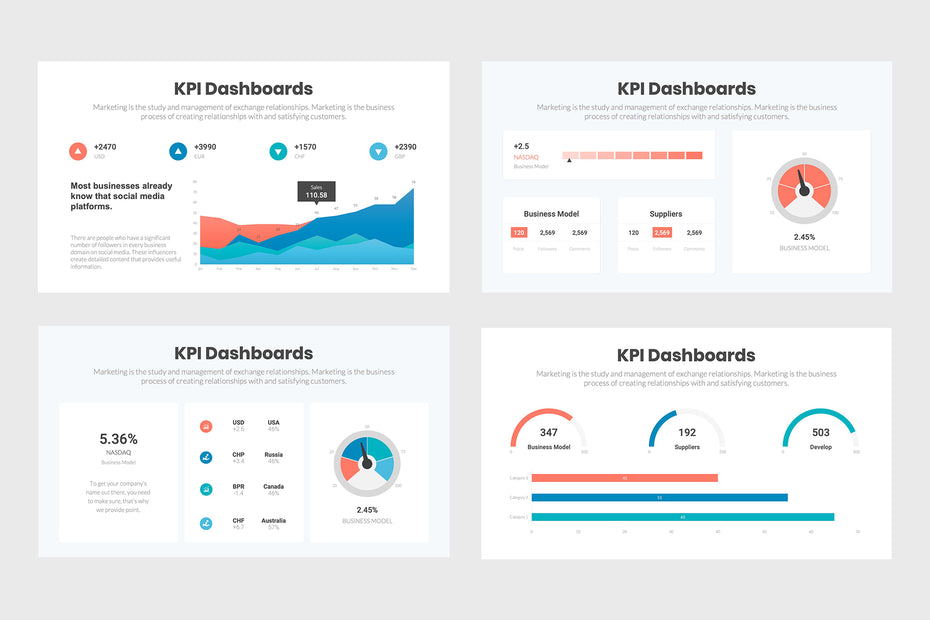

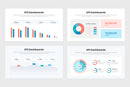
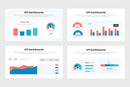
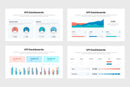
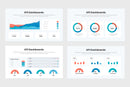
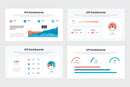
KPI Dashboard Infographics
KPI Dashboard Infographics help to break down complex financial information into small, manageable numbers and pie charts that are color-coded. They make it easy for everyone in your organization or business to understand the overall performance of the company. All KPI Dashboard infographics are customizable and personalized within variety parameters.
These infographics are compatible with:
- MS PowerPoint
- Apple Keynote
- Google Slides
Customer Reviews
Based on 4 reviews