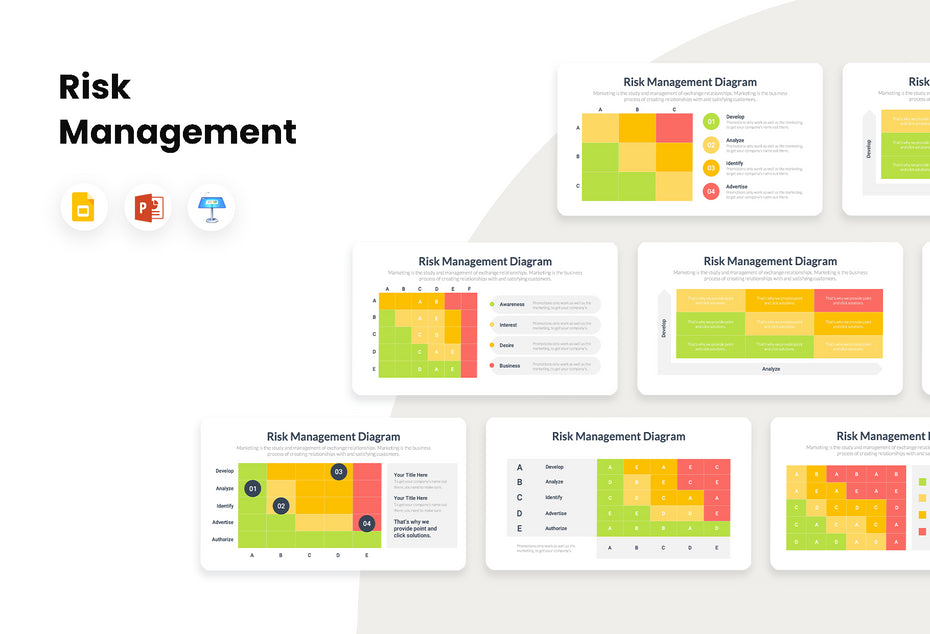
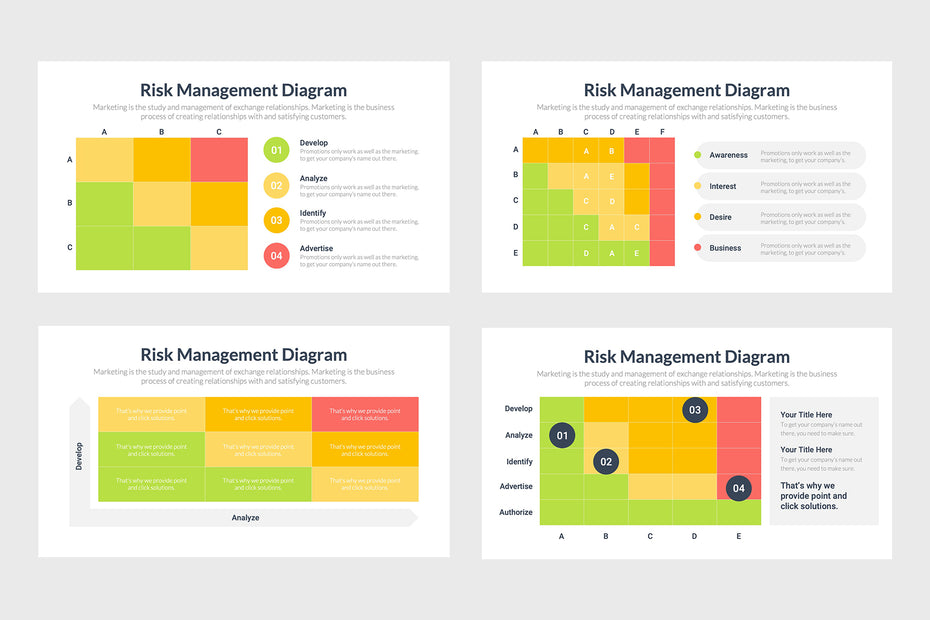
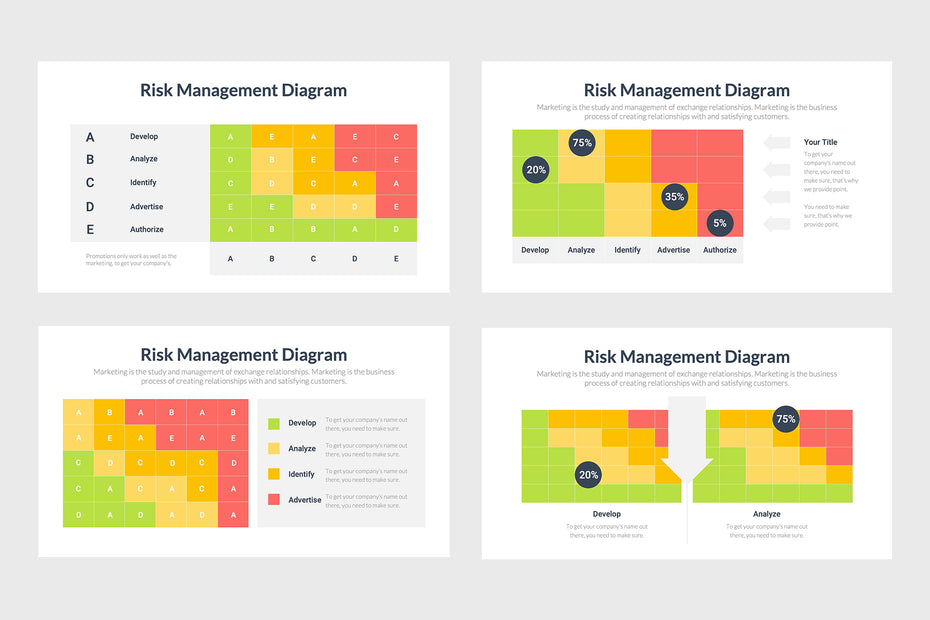
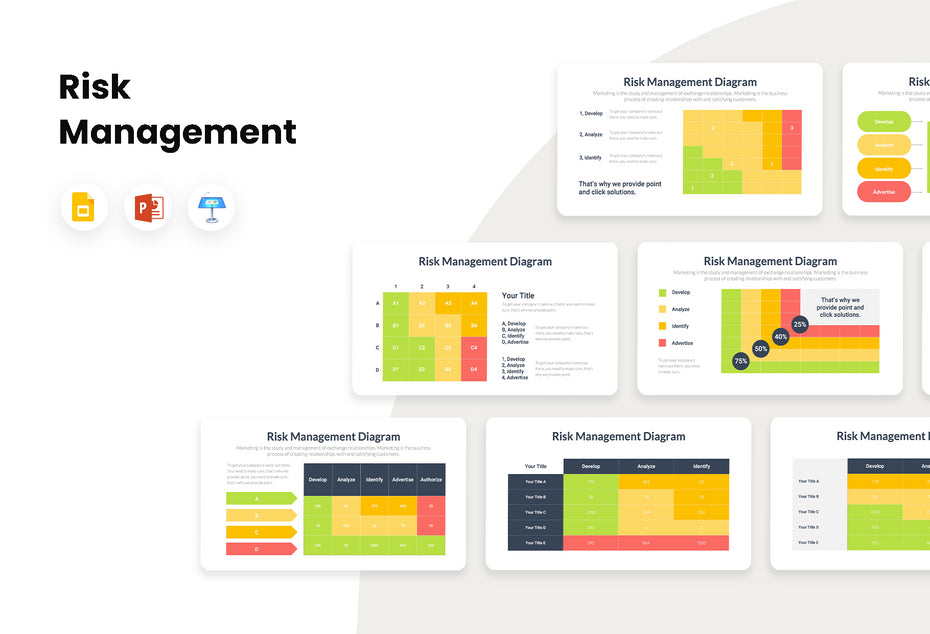
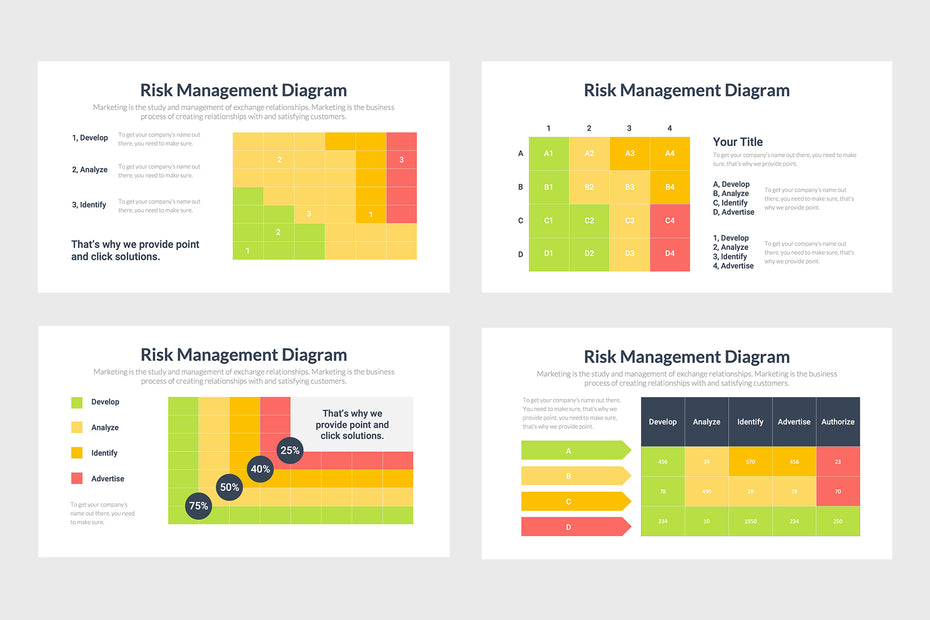
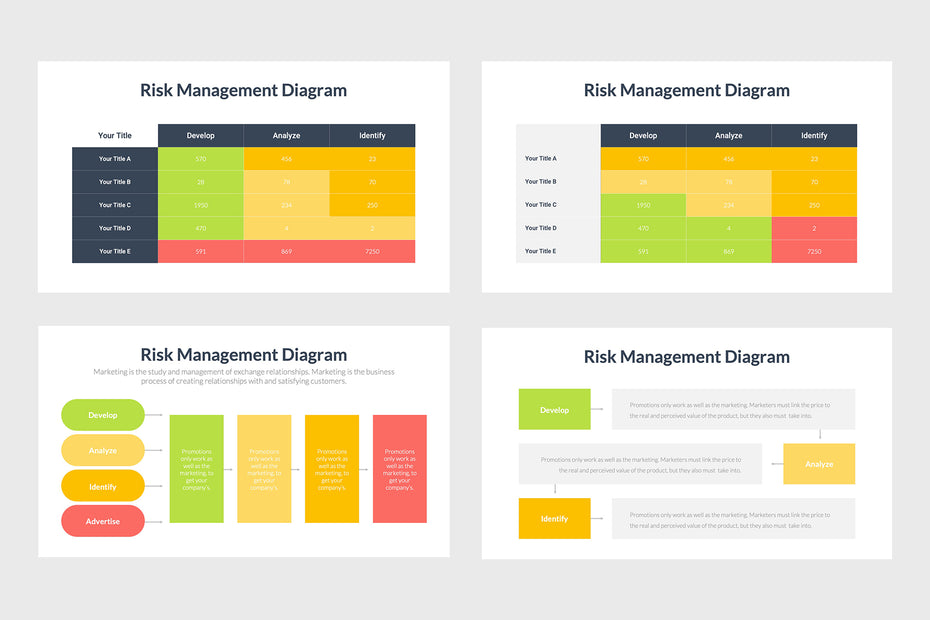
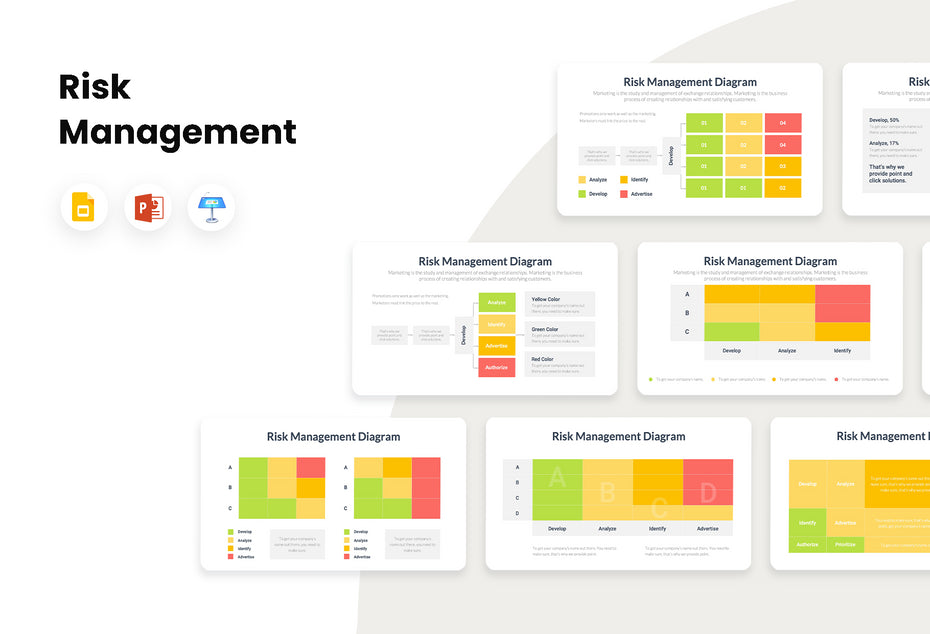
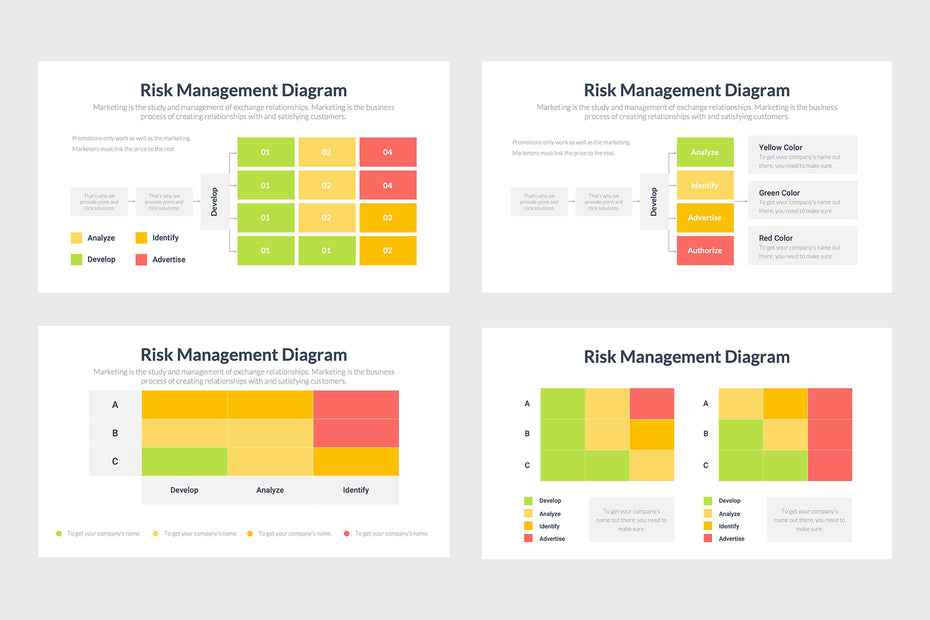
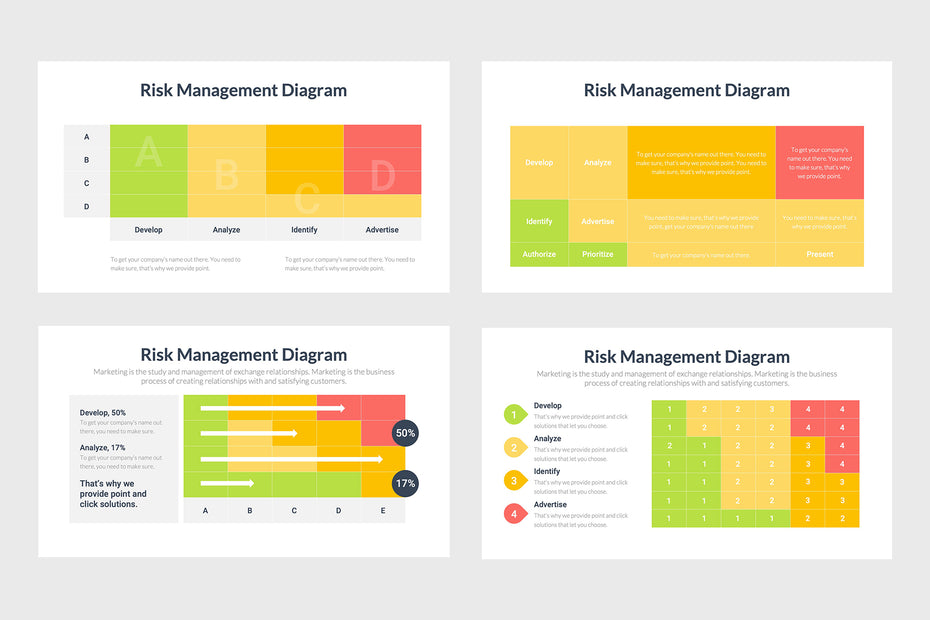
Risk Management Infographics identifies where organizational priorities should be within companies based on stages that are associated with each potential failure outcome. You can use these infographics to evaluate what paths may lead to success or downfall so that you can rank organizational intentions accordingly and evaluate how much investment is needed at every stage from the time production starts.
These infographics are compatible with:
- MS PowerPoint
- Apple Keynote
- Google Slides
Customer Reviews
Based on 1 review
