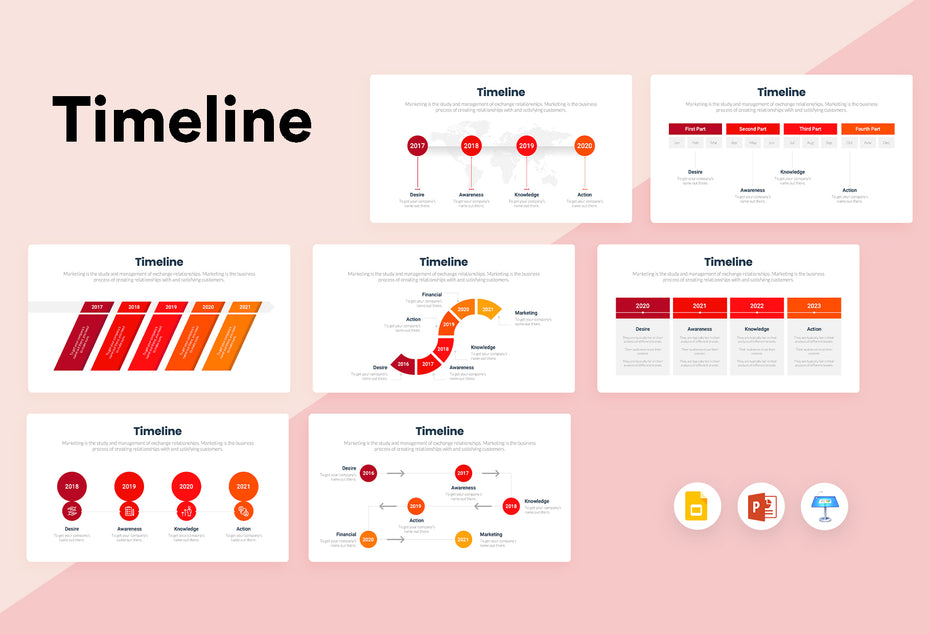
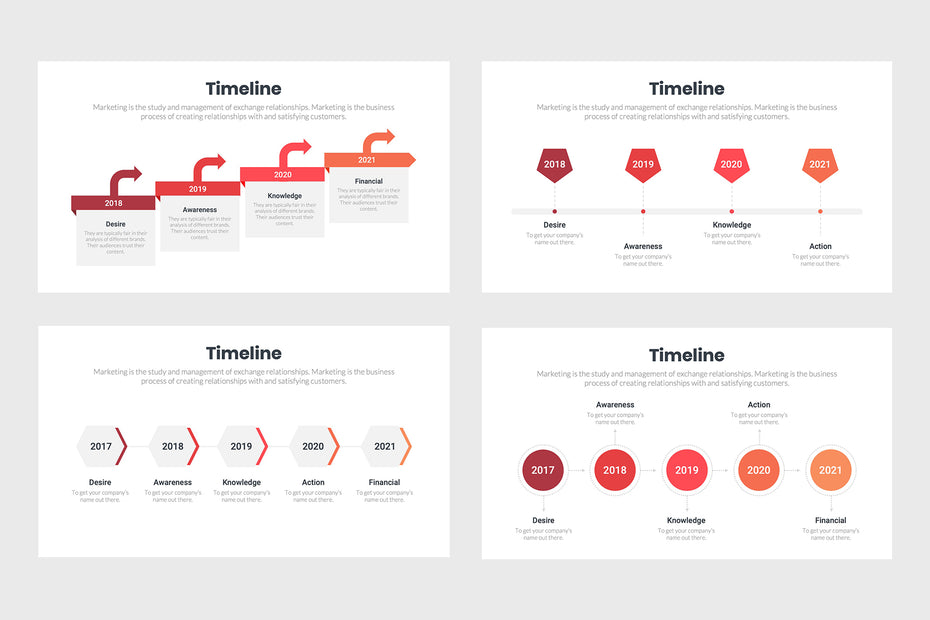
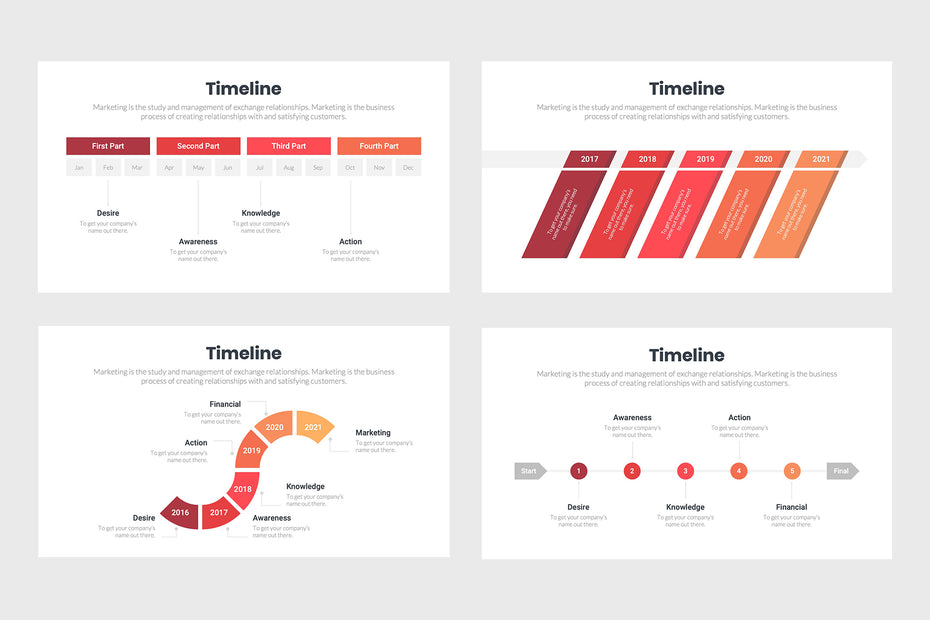
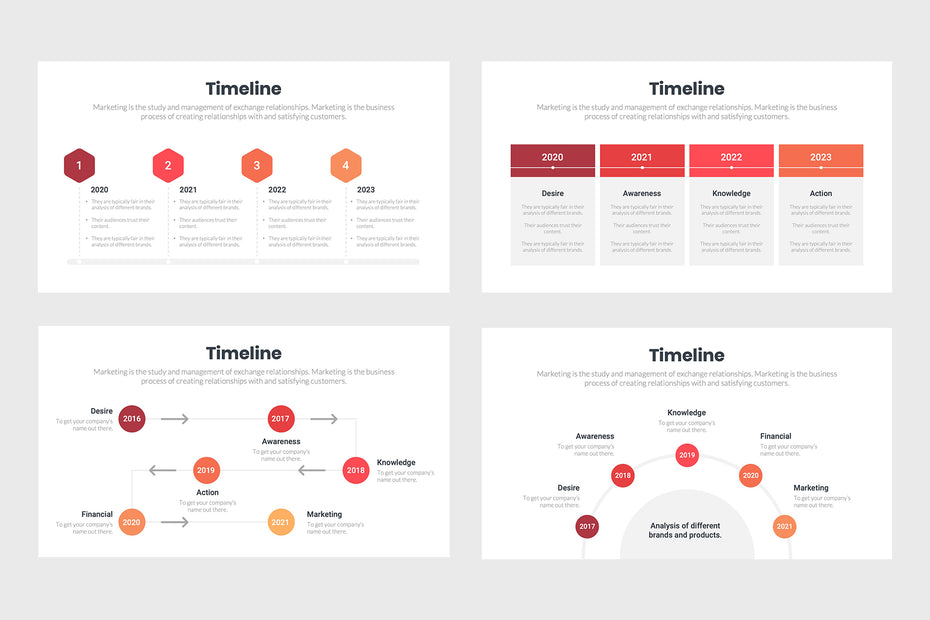
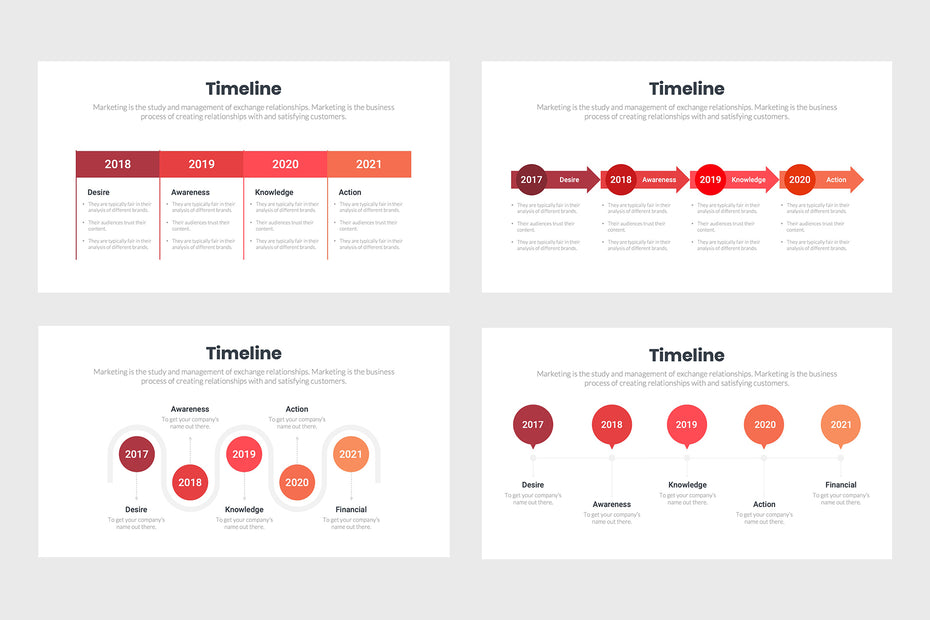
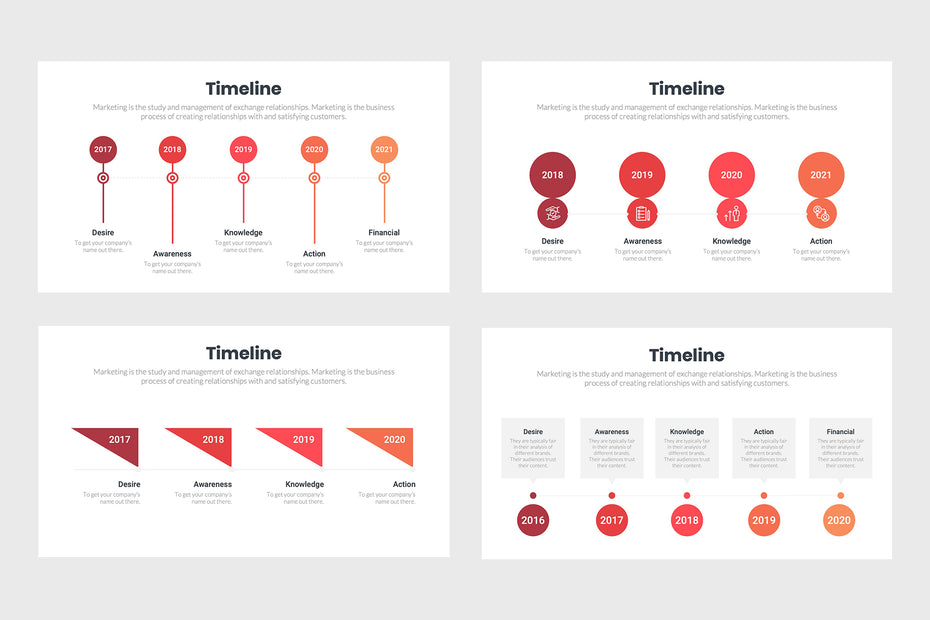
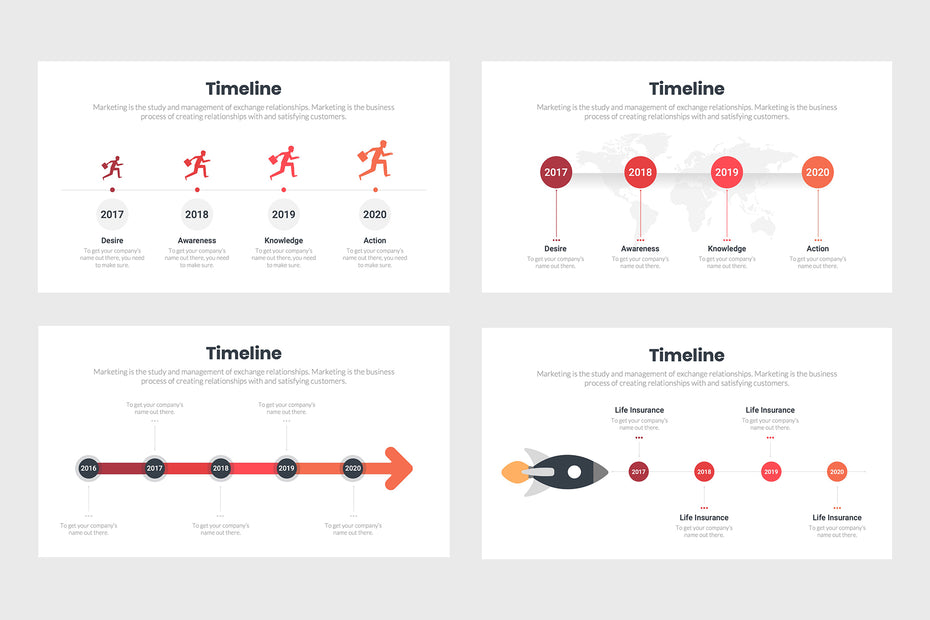
The Timeline Infographic is a powerful new way to present your financials, business model, and strategies. You'll be able to use these infographics in order to show how well you've been performing over time, visually depicting the steps that led up to those numbers. Not only will this offer people clarity on what happened at various points of your company's lifetime, it also makes for engaging presentation material when showing opportunities and future goals.
These infographics are compatible with:
- MS PowerPoint
- Apple Keynote
- Google Slides
Customer Reviews
Based on 3 reviews
