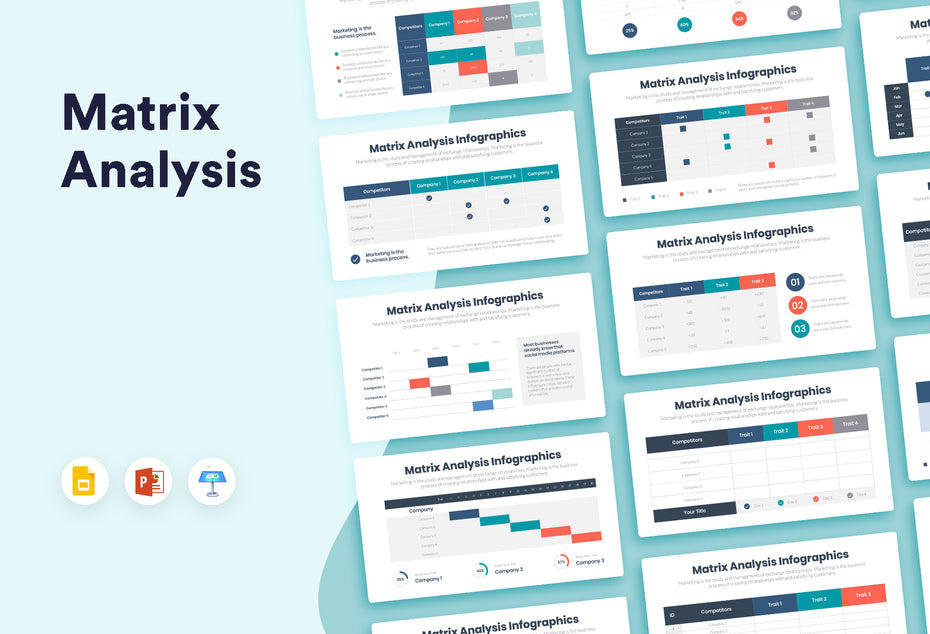
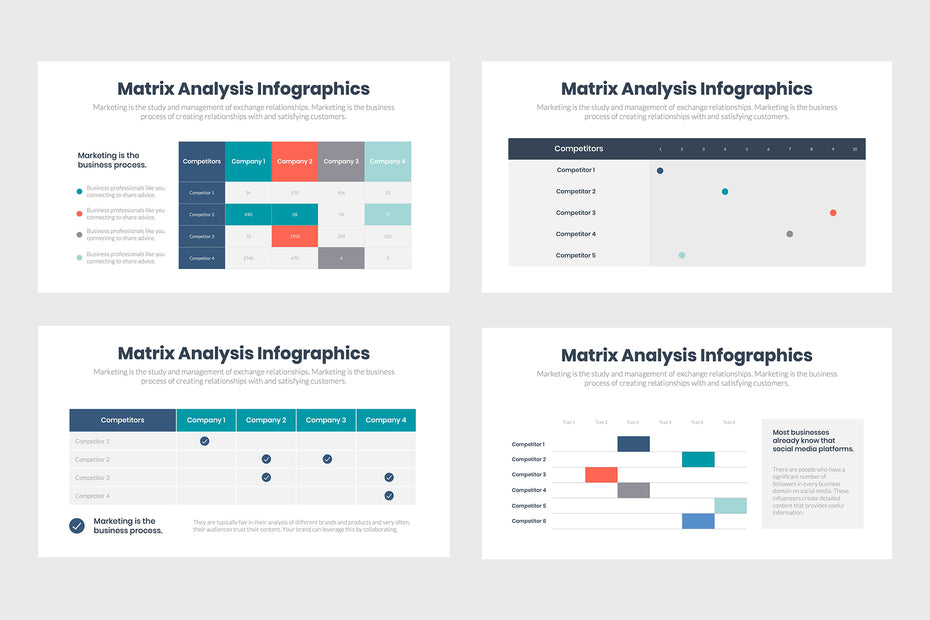
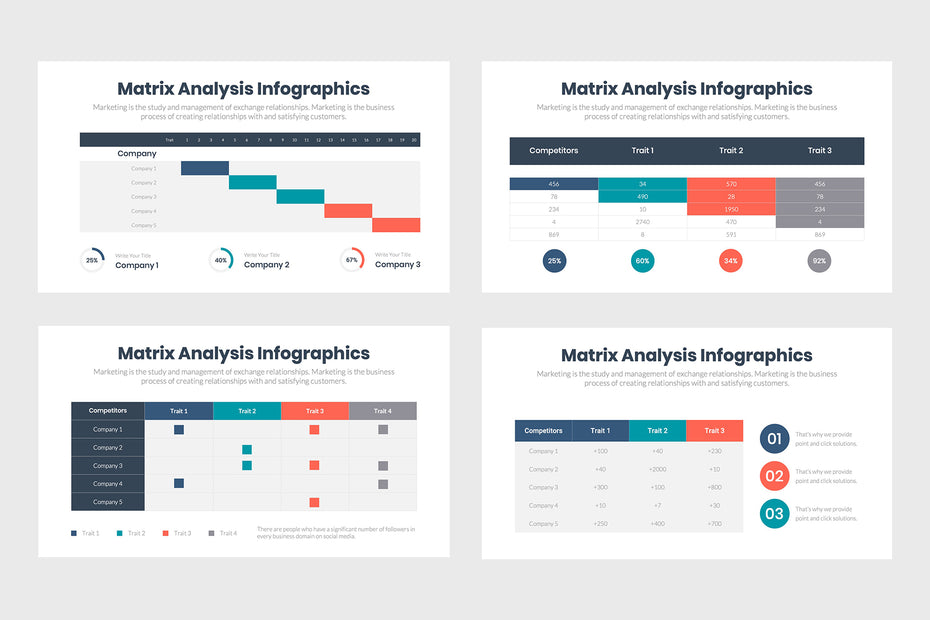
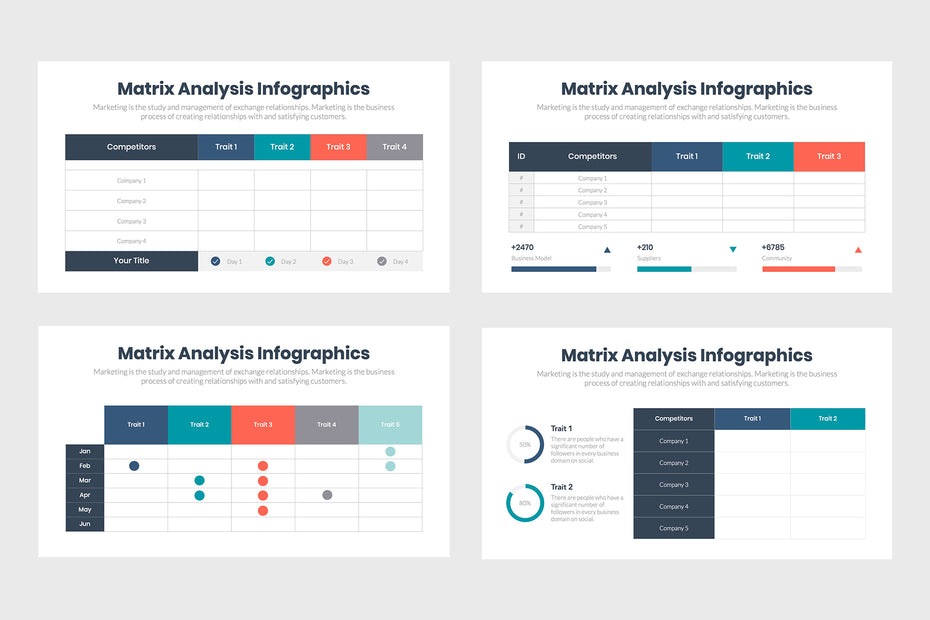
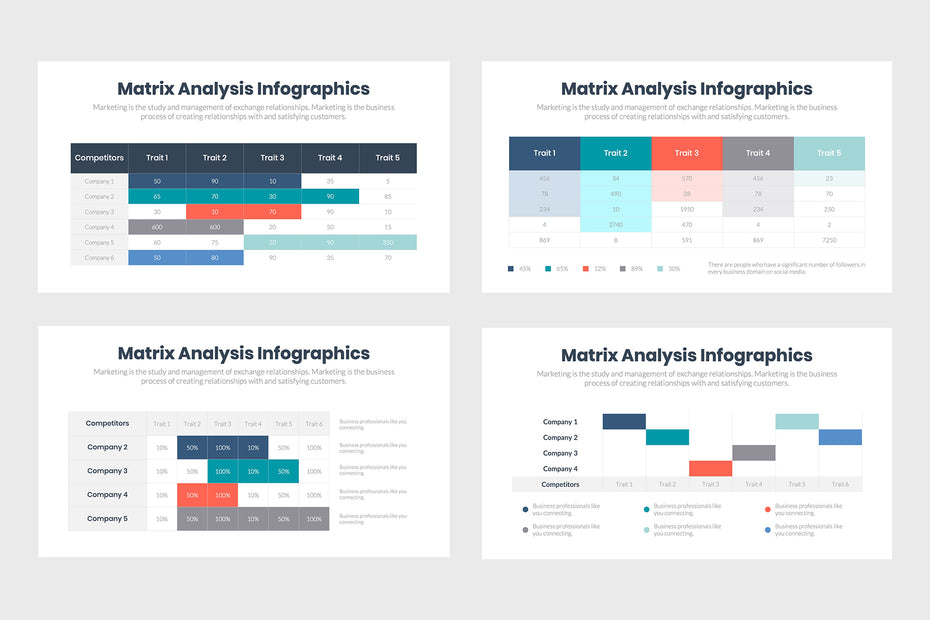
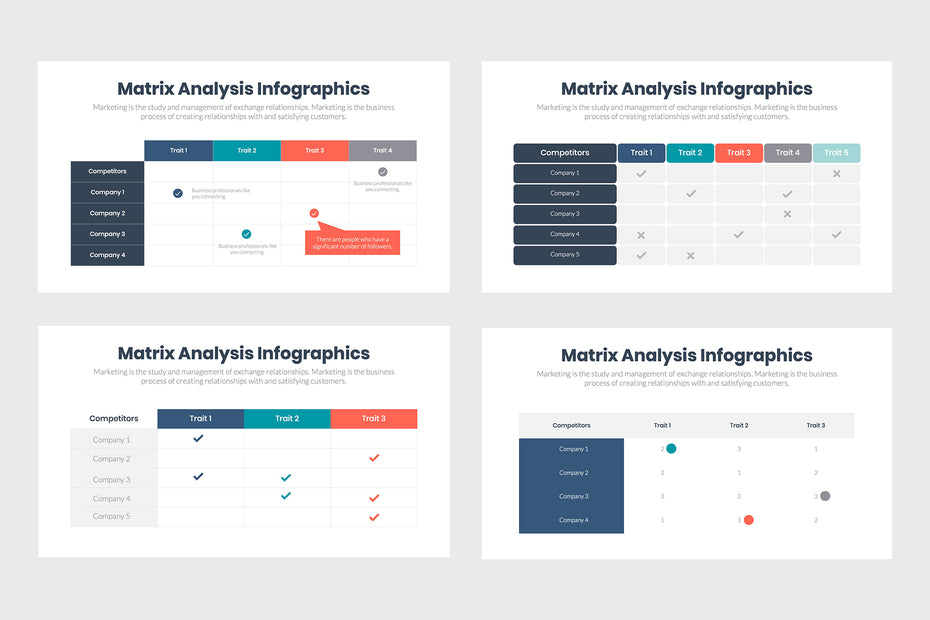
Use Matrix Analysis Infographics to compare the different ways graphs and charts can show data. Reviewing multiple equations in one slide is really convenient when creating a new marketing strategy.
The benefits of these infographics are that you and your team can see all different perspectives at the same time, making it easier to understand data.
These infographics are compatible with:
- MS PowerPoint
- Apple Keynote
- Google Slides
Customer Reviews
Based on 1 review
